Data-water nexus: unlocking the potential of data to communicate
As the water sector continues to digitise operations and uncover new insights, one leading design firm is leaning into the power of data and digital to communicate, spark imagination and unlock the potential of the digital-water nexus.
Last month, Arup’s in-house Design Innovation Fair showcased an impressive array of cutting-edge applications of digital and data tools to help explore pressing water-related challenges and drive conversations around water management.
Bringing together data to create links between disciplines, projects and stakeholders, Arup’s geospatial team leverages its data hub to enhance communications by creating digital models to drive greater understanding of the scale and scope of works.
Arup Spatial and Data Team Leader Andrew Barker said the variety of digital tools on display for engagement and interaction at the Design Innovation Fair showcased the incredible potential for data to help deepen understanding across the sector.
“What we have here with digital and water is an amazing opportunity, and we have only just walked through the door of the data-water nexus,” he said.
“At Arup, we have worked on some really interesting projects where we have thought about what the client wants, and delivered that, but then the work itself has generated the next set of questions or pathways to explore.
“Sometimes the existing question or thought we work on is limiting. But once we step over the data threshold, we recognise very quickly that there is so much more to learn about the topic.”
While applying data to create deeper insights into important issues is one part of digitisation, Barker said that, when leveraged well, data also offers a fantastic tool for communication that’s immersive and highly effective in shifting perspectives.
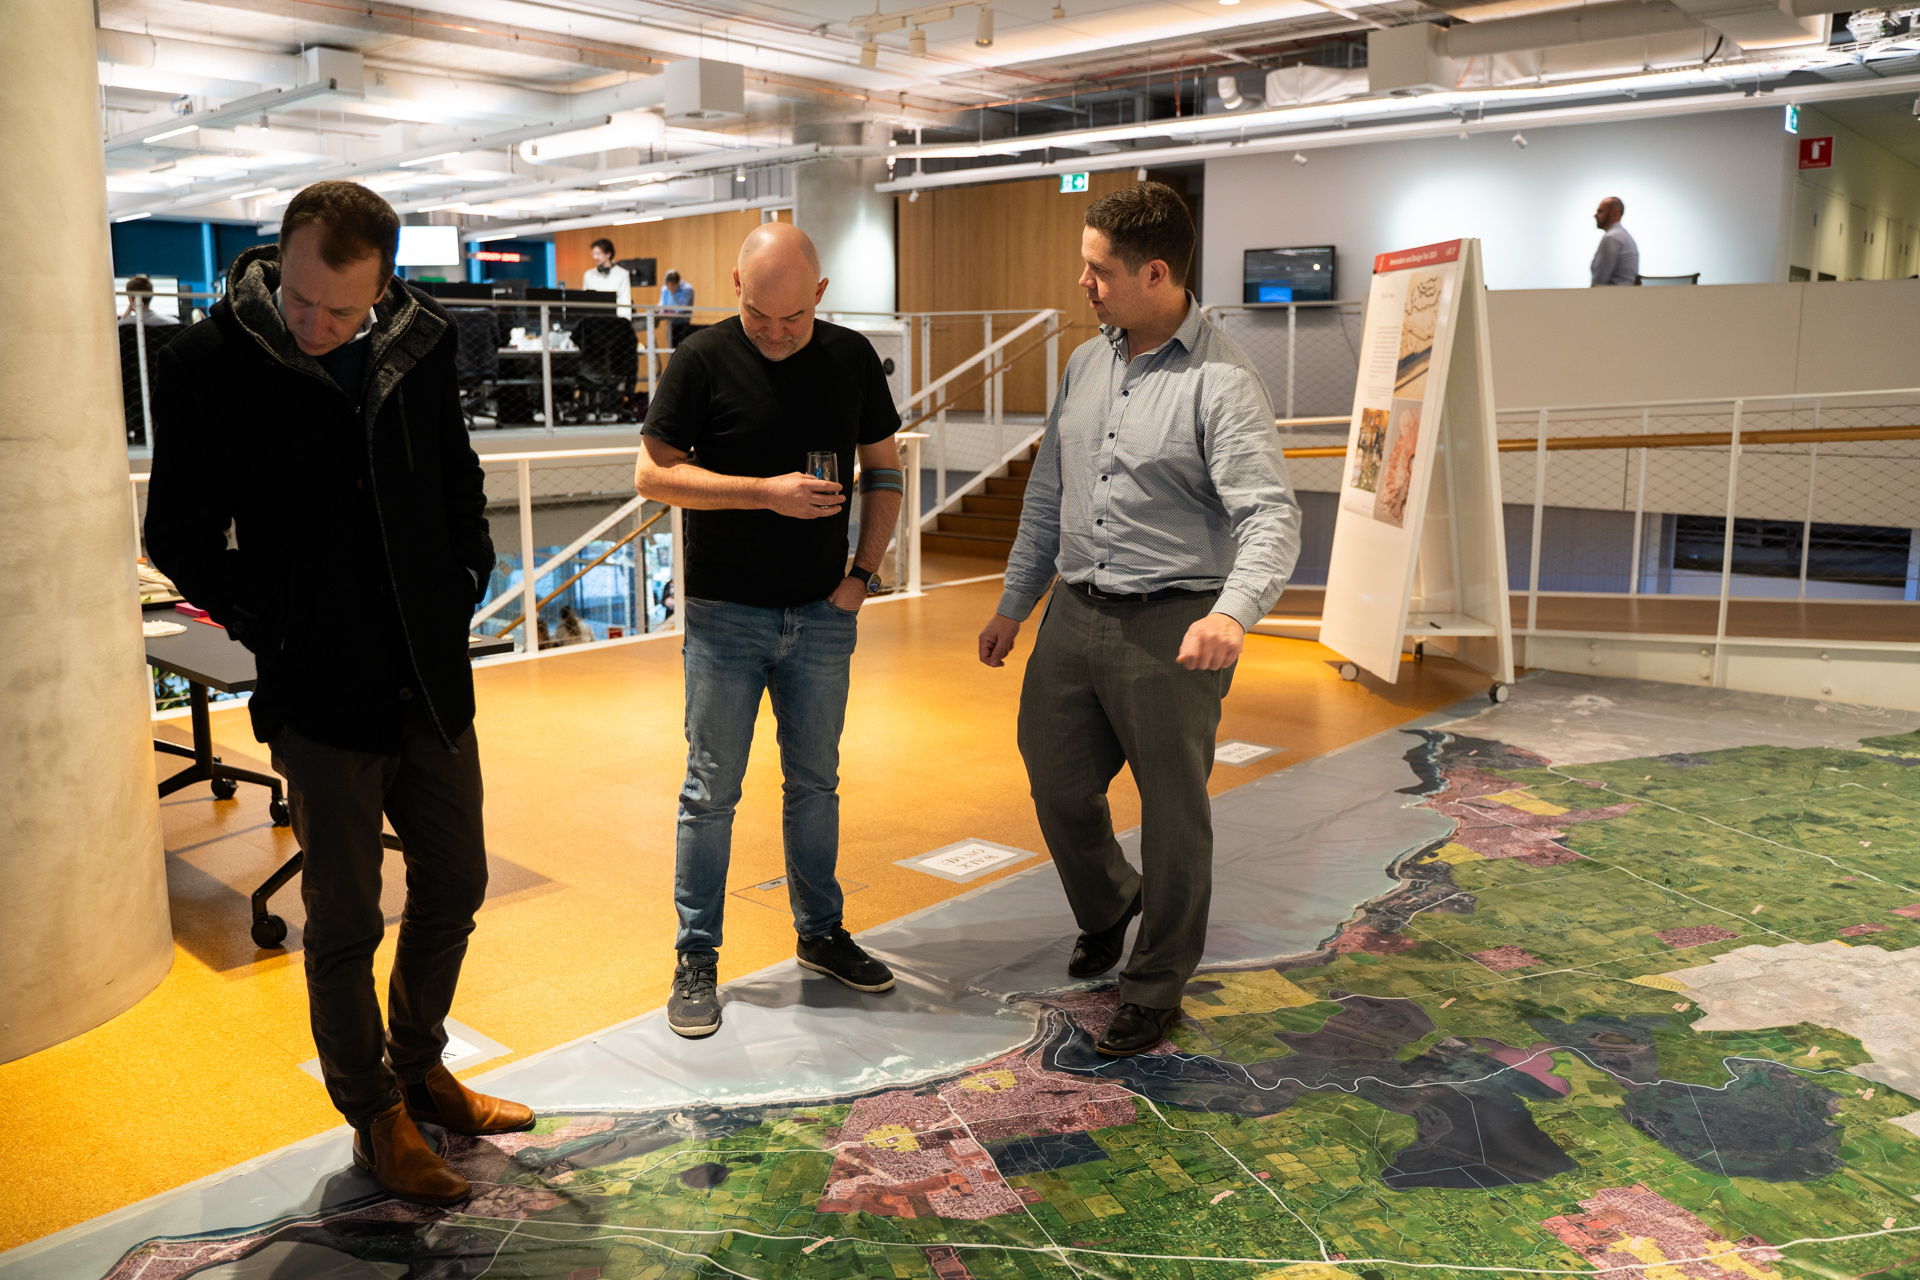
“The hero of the day was a gigantic map of the Bellarine Peninsula that could be walked across, and we encouraged people to physically engage with it,” Barker said, describing the 8m x 4m map displayed at the Design Innovation Fair.
"We decided to do an all-analog demonstration, which makes me sound like a bit of a dinosaur. But everything we produced came from digital ingredients. There is a massive amount of data, and we brought it out of the computer to communicate and engage.
"The greater the level of understanding we can give our audiences with these tools, the more success we have. People quickly scroll past a map when looking at it on a computer. But when you are standing on it, it creates a much more engaging and memorable experience.”
Innovations on display
Digital applications for water-related issues and challenges on display at the Arup Design Innovation Fair included:
Strategic Integrated Water Management (IWM) Prioritisation Map for the City of Melbourne, created using digital tools and geospatial analysis to identify the most practical and beneficial locations to retrofit IWM features in urban streets.
The Arup project team collaborated with the City of Melbourne to assess the suitability of street sections for IWM initiatives, determine whether they should be prioritised based on benefits to urban heat, flooding and water quality, and then recommend different design typologies based on localised constraints.
Structural remediation modelling for the Barwon Aqueduct, which utilised GPS coordinate acquisition, drone capture specification, ground-based LiDAR and a 360-image virtual tour with data sets enabling review, design and approvals on a culturally sensitive site;
Stormwater management optimisation utilising artificial Intelligence to automate MUSICX modelling, to test the technical feasibility and cost of meeting stormwater harvesting targets in over 460 development scenarios;
3D visualisations of flood events using simulated real and design flood-event time series data sets developed for use across 3D design and GIS analysis software platforms, helping stakeholders, floodplain managers and engineers to understand, communicate and respond to flood events and solution scenarios; and
Great Ocean Road mapping using 3D-printed and laser-cut maps to give the audience an opportunity to hold and interact with a landscape in an innate way, developing a greater understanding of scale.
Unlocking potential
Barker said the work Arup does with its clients in data and digital is expansive in nature, which is one of the reasons working with data is exploratory, and necessary for organisaitions seeking to push boundaries.
“One example of this is some work we have done with a major metro water utility recently. We were helping them with demand forecasting to figure out how much water was going to be consumed in 2056 across the network,” he said.
“We were processing 2.4 million data points into 170 different attributes – it was a massive matrix of information that we were working with. And all of this work came about because an engineer made an inquiry.
“That project has now grown into something so much more than an answer to a question. It’s become a tool for communicating, asking and answering many more questions. That’s really where we are unlocking potential.”
Share