Effective monitoring of trihalomethanes in water supply systems
By A Sathasivan, G Kastl, I Fisher.
First published in Water e-Journal Vol 5 No 4 2020.
Abstract
To ensure public health safety, water supplied to consumers should meet both microbiological and disinfection by-product (DBP) requirements. Water utilities are ensuring microbiological safety of water, but there is considerable variation in monitoring and reporting trihalomethane (THM) levels across Australia, for the obvious reasons of cost and lack of resources and skills to monitor total THMs (TTHMs). Such practices lead to neglecting the long-term health risks from DBPs, which are often exacerbated by overdosing chlorine.
To overcome these problems, we suggest two simple methods, which calculate and record the maximum TTHM levels in a system from regular monitoring of chlorine. Both methods calculate the TTHM concentration by multiplying the chlorine demand by the yield. The yield is the mass of TTHMs formed per unit of chlorine demand (µg-TTHM/mg-Cl2). The chlorine demand is the sum of all chlorine doses minus chlorine measured at any point in the system. The simplest method uses a fixed yield derived from a wide range of waters. The second method estimates the system-specific yield from measurements of TTHMs and corresponding chlorine concentration at two locations.
Both approaches can be used to estimate the maximum TTHMs based on dosed chlorine. Either approach will raise awareness among water utility operators and regulators of the long-term chemical risk to consumers’ health and identify any need to reduce it.
Introduction
Chlorination is the cheapest, most widely used method of disinfection for drinking water supplies. Its primary function is to minimise acute (immediate) risks to human health by inactivating bacterial pathogens before water reaches any consumers.
Since the 1980s, the Australian Drinking Water Guidelines – ADWG – (NHMRC, NRMMC 2011) have included a requirement that there should be no coliform indicator species found in any sample taken from a distribution system. The density and frequency of sampling, requirements for reporting non-compliant results to State/Territory Health Departments and remedial measures are also prescribed. This regulatory framework is now well embedded in the water industry nationwide.
To meet the requirement of no microbial indicator species in any sample, a residual (chlorine concentration) is maintained in the distribution system, sufficient to prevent microbial regrowth (Table A1.10, AWDG) until water reaches the furthest consumer. Fisher et al. (2019) developed a framework to find cost-effective chlorine dosing strategies (including re-dosing) to achieve this goal, based on new, accurate models of chlorine decay (Fisher et al, 2015; 2017 a, b). Chlorine dosing strategies to maintain a sufficient chlorine residual are also in widespread practice.
Since the 1970s, there has been increasing recognition that chlorinated disinfection by-products (DBPs) present chronic health risks from long-term consumption and other exposure (de Castro Medeiros et al, 2019). Since the 1990s, the ADWG have included a guideline limit of 250 ug/L for total trihalomethanes (TTHMs), which occur at the highest concentrations of all DBPs and probably constitute the most prevalent health risk (ADWG, 2011). This is a substantially higher limit than those regulated by either the EU (100ug/L) or the US (80 ug/L) (Health Canada, 2006; WHO, 2017). There is also a move to limit individual THM species because of their considerably different toxicities (Wagner and Plewa, 2017). In Australia, reporting and monitoring requirements are controlled by the licensing authority in each state. Each state, therefore, has its own requirement and there is a large variation across Australia (AECOM, 2010).
The ADWG anticipate generally monthly, or at least quarterly, frequency of measurement of chemical substances (p. 171, ADWG, 2011). Long-term performance against a health-based guideline of a chemical substance is to be determined by the maximum result, where only a small number of samples are taken annually (p. 171, ADWG. 2011). Far fewer locations are generally required for chemical sampling (as in the case of THMs) than for microbiological sampling. For THMs, sampling locations are suggested to be representative of water supplied (Section 9.5.2, p. 142, ADWG, 2011).
There is no recognition that the maximum levels of THMs will occur at locations farthest from the initial chlorine dose, in terms of travel (and reaction) time, and at times of highest water temperature. Consequently, cost-effective monitoring should adopt a method of sampling and measurement, where “effective” means the sampling identifies the highest level of THMs occurring in the system. For small numbers of samples taken annually, performance should be characterised by the maximum value, which will probably be obtained in summer. For systems taking more than one sample per month at system extremities, averaging over these locations would be consistent with the ADWG definition of performance.
Even with this focus, the locations of greatest reaction time must be identified. A well-calibrated hydraulic system model would provide the best means of identification (Fisher et al., 2019), but this is not likely to be available for many small systems. Even if it is, there may be several candidate sub-zones in which maximum THMs occur under different operational conditions, so that sampling at several sites and times would be needed. The cost of sampling and THM analysis would vary from water utility to water utility, but could be several thousand dollars annually for larger utilities. If no well-calibrated hydraulic system model is available, then a more extensive and costly sampling/analysis program would be required.
Others have suggested that direct measurement of surrogates for THMs would reduce the analysis costs involved, e.g. by using UV absorbance. However, the relationship between THM concentration and such surrogates is generally different in different source waters, so that prediction of the THM level and comparison with the THM guideline is much more uncertain (Ikechukwu et al., 2019).
In addition to comparison of direct THM measurements against the guideline, the ADWG suggest that THM formation potential of the source water should be evaluated. However, this measure does not represent the actual maximum TTHM concentration occurring within the distribution system supplied by this water because the standard test conditions of dose, temperature and reaction time are usually quite different from those encountered in the system. It is therefore not an effective method of determining maximum THM levels in a distribution system.
We argue that a regular direct sampling and measurement of THMs or any surrogate is unnecessary, as there is a more cost-effective way to determine the maximum THM levels occurring in the system. This relies on the strong relationship between chlorine demand and TTHMs or THM species formed after any specified reaction time (Fisher et al., 2004; Sathasivan et al., 2020), which we consider in detail in the following sections.
Typical TTHM formation behaviour in water
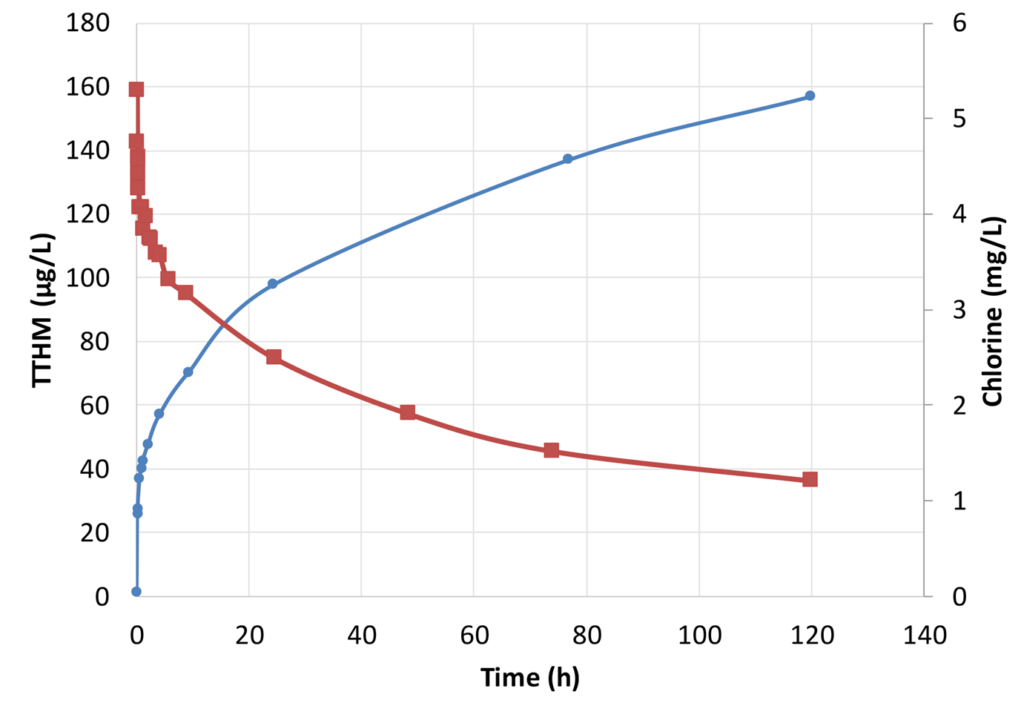
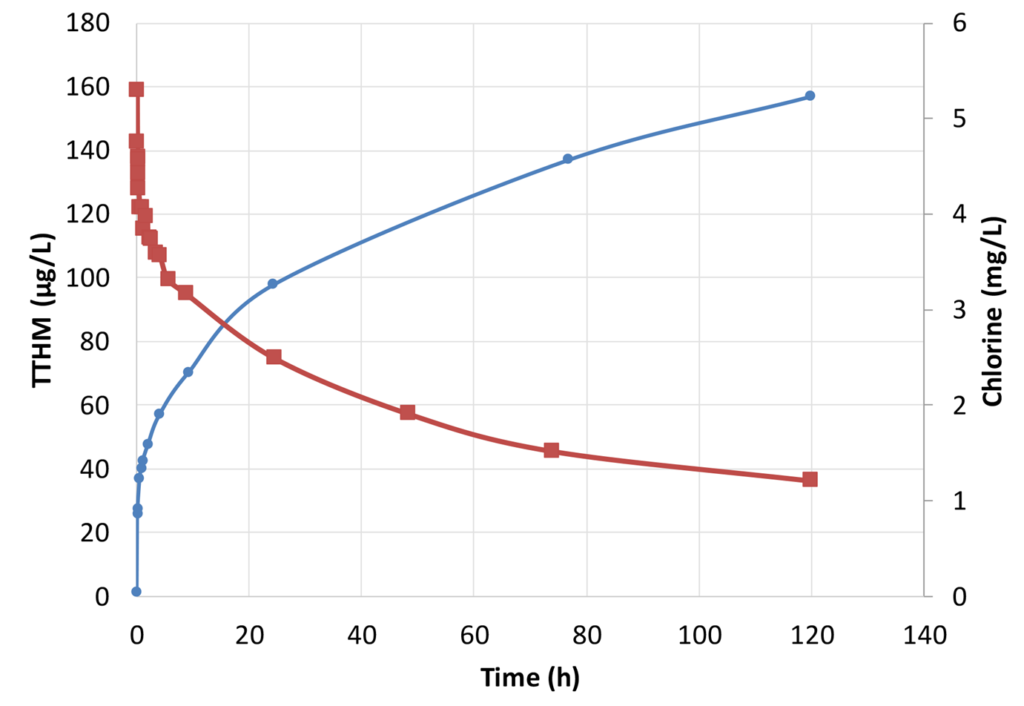
A simplified approach to monitoring THMs depends on an understanding that THM formation is connected to an easily measurable parameter – (free) chlorine. There is also an advantage that chlorine is already routinely measured to meet disinfection requirements. Figure 1 shows typical mirror-image behaviour of TTHM and chlorine concentrations following chlorine dosing. In Figure 2, the TTHM concentration (formation) is plotted against chlorine demand after successive times following dosing. Chlorine demand is calculated as chlorine dose minus chlorine concentration at each measurement time.
Figure 2 demonstrates that TTHM formation is almost proportional to the chlorine demand. The proportionality constant is defined as a yield. The yield in this case is 37.7 µg-TTHM/mg- chlorine demand. If the last point of TTHM concentration (157 µg/L) and chlorine demand (4.08 mg/L) is considered, the slope (yield) is 157/4.08, i.e. 38.4 µg-TTHM/mg-chlorine demand. The deviation of the regression line is related to the presence of ammonia or other inorganic ions such as iron and manganese in the water (Sathasivan et al., 2020).
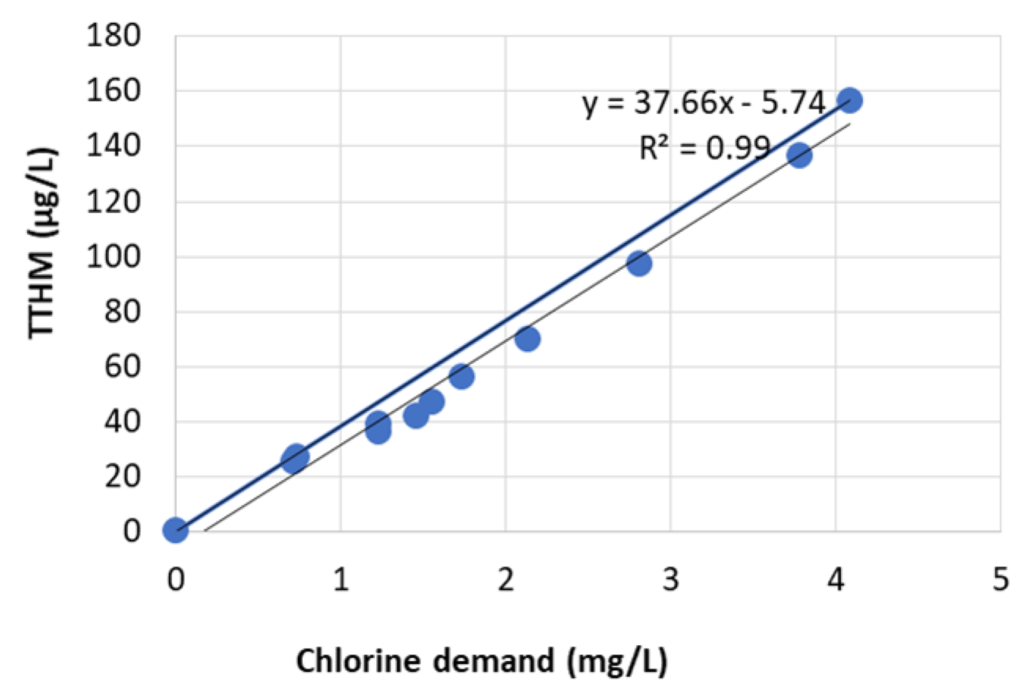 Figure 2: The relationship between TTHMs and chlorine demand. Note the thick line connecting the last point and the origin gives a conservative estimate of TTHMs after any given time. The conservative estimate of yield is the slope of the straight line connecting last point and origin (157/4.08) = 38.4 µg-TTHM/mg-chlorine demand. The conservative estimate is close to the yield (37.7) obtained by linear regression (thin line).
If water is collected after filtration, it would contain minimal ammonia, iron or manganese. It will also contain some chlorine residual and TTHMs, assuming some level of pre-chlorination is employed in the treatment plant. The post-filter relationship between TTHM concentration and chlorine consumed will be linear.
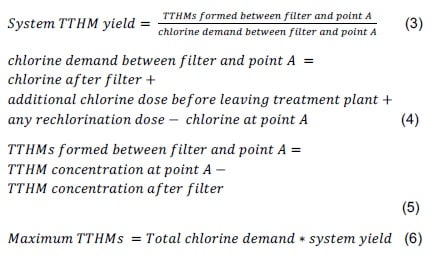
Therefore, the following formula could be used:
where the total chlorine demand is the total chlorine dosed minus the minimum chlorine residual at the furthest customer’s tap. The yield has the unit µg-TTHM/mg-chlorine demand.
Most importantly, this formula informs a utility that if they increase the amount of chlorine (kg) dosed per ML of water, the chlorine demand will increase and TTHM formation will increase proportionately for a given water sample.
Prediction of maximum TTHMs does not depend on hydraulic variability
One of the frequently changing aspects in a water supply system is the flow and thus retention time. Therefore, even if the sampling is done at the same location, THM or chlorine concentration can vary making it difficult to estimate the maximum TTHM concentration easily. When sampled at different locations, different results are also obtained and hence water utility operators may have to collect samples across the whole network.
The yield approach, however, unifies these sampling events, irrespective of when or where the sample is collected. To demonstrate, three readings at very different reaction times are chosen from Figure 1 and listed in Table 1. The maximum TTHM concentration is estimated using only the measurement at that point and the known yield of that water. The yield of 37.7 µg-TTHM/mg-chlorine demand as in Fig 1 is adopted.
In Sample 1, measured TTHM and chlorine were 73 µg/L and 3.2 mg-Cl2/L, respectively. The sample already contains 73 µg/L and with each mg/L of chlorine demand, 37.7 µg/L of TTHM formed. If all 3.2 mg-Cl2/L is allowed to react, additionally 3.2*37.7 µg/L (120.6 µg/L) of TTHM would form. The predicted maximum is 193.6 (≈194) µg/L. For other samples collected at 24 and 74 hour retention time, the calculated maxima are 192 and 190 µg/L.
It is obvious that all the samples originated from one water source and hence the predicted maxima are very close (192±2 µg/L). In a water supply system, the raw water quality (especially NOM, bromide and temperature) changes over the year, hence the variability of yield for highly variable source waters within Australia and the US.
TTHM yield variation in 13 water samples from the US and Australia
Sathasivan et al. (2020) analysed the data obtained from chlorine decay tests carried out on 13 water samples of varying water quality (Figure 3). Water samples were collected from 11 geographically diverse water sources: nine from nine states of the US and two from two Australian states. Before conducting chlorine decay tests, some samples were either treated by a conventional water treatment plant (consisting of coagulation/flocculation/sedimentation/filtration) or by enhanced coagulation.
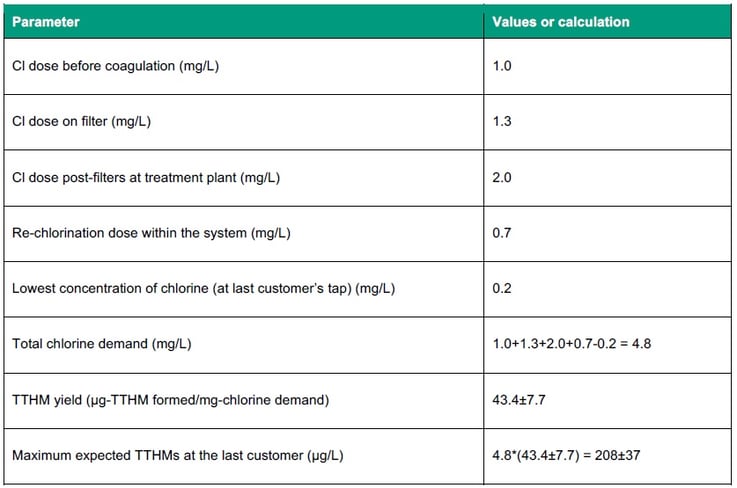
In two cases, the data for raw water and coagulated water are included; thus, there are 13 different data points. In these 13 samples, the yield values were 43.4±7.7 (average ± standard deviation) µg-TTHM/mg-chlorine demand (Figure 3). The TTHM yield of 37.7 µg-TTHM/mg-chlorine demand in Figure 2 is within this previously observed yield range in Figure 3.
The DOC and SUVA of the samples varied by approximately 7 and 4 times, respectively (Figure 3), yet the yield fell within a narrow range, i.e. the yield from 85% (11/13) of the samples changed by less than ±18% (7.7/43.4*100).
As NOM changes, what changes significantly is chlorine demand. In a single water source or water supply system, the variability will fall within a narrower range and the yield variability will narrow. Greater confidence in the yield approach could be gained by two types of studies. The first is the collection or analysis of data in one water utility or in multiple water utilities over different seasons and in different water sources. The second is the systematic study in diverse water samples to understand the variability of yield with respect to bromide, temperature and pH.
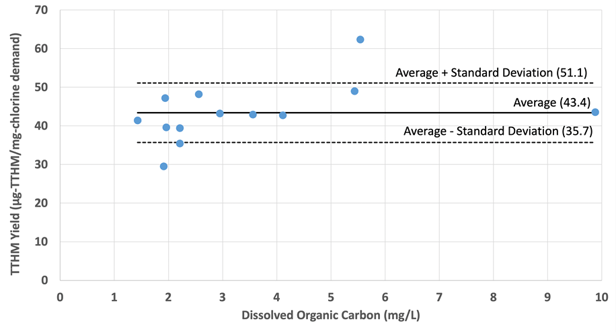 Figure 3: The relationship between DOC and the TTHM yield for 13 water samples having the following characteristics: UV, 0.028 - 0.345 /cm; SUVA254, 1.52-5.84 L/mg-m; bromide, 0.03 – 0.195 mg/L. Test conditions were: chlorine dose, 2.2 - 9.8 mg/L; pH 7.2-8.1 units; and temperature 15-23oC. These were either raw water (five samples), enhanced coagulated water (seven samples), or water treatment plant treated water (one sample). It includes data for 11 surface water sources, two in Australia and nine in the US. More details of these samples where given by in Sathasivan et al., (2020).
Simplest method (Method 1) to estimate maximum TTHMs
A water utility can crudely estimate the maximum TTHMs in water by measuring the total chlorine demand and knowing an approximate concentration of bromide, assuming that no THM data is available for the system. For this purpose, we suggest the yield value of 43.4±7.7 µg-TTHM/ mg chlorine demand as calculated by Sathasivan et al., (2020) and presented in Figure 3.
Therefore, the following generalisation of Equation 1 could be used:
As chlorine is usually dosed to achieve a minimum chlorine residual at the customer tap of approximately 0.2 mg/L, we suggest chlorine dose is a good proxy to estimate the maximum TTHMs formed in the system in the absence of minimum chlorine concentration at the last customer. Therefore, the water utility can simply calculate the maximum TTHMs by calculating how much chlorine is added. An example is presented in Table 2.
Note that the TTHM concentration in the system could be different to the maximum calculated in Table 2 due to the presence of ammonia, iron and manganese in raw water and corrosion or biofilms on the pipe walls. Nevertheless, it provides an ongoing reminder of likely TTHM concentrations in the system, as the dose is changed over the seasonal cycle.
System-specific yield method (Method 2) to estimate maximum TTHMs in the system
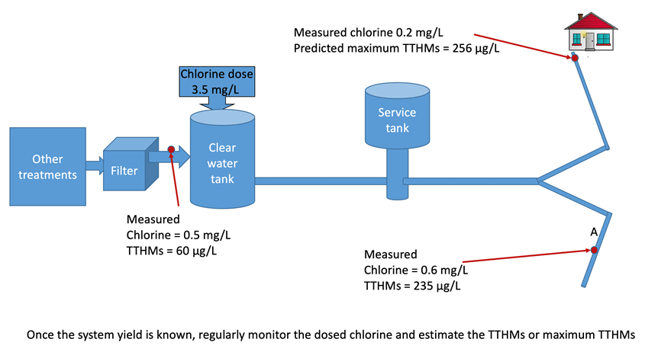
Method 2 is based on estimating system-specific yield. It depends on measurement of TTHMs and corresponding chlorine concentration at two locations to estimate the maximum TTHM concentration (Figure 4). This is after the filters at the treatment plant and some convenient downstream location in the distribution system, which is named “point A”.
As most ammonia, iron and manganese would have reacted with chlorine by the time water exits the filters, TTHM formation can be assumed proportional to the chlorine reacted post-filtration. In addition, in-system reactions with chlorine, such as corrosion, can be taken into account in the system-specific yield calculation if a sample from point A in the distribution system is analysed for chlorine and TTHMs.
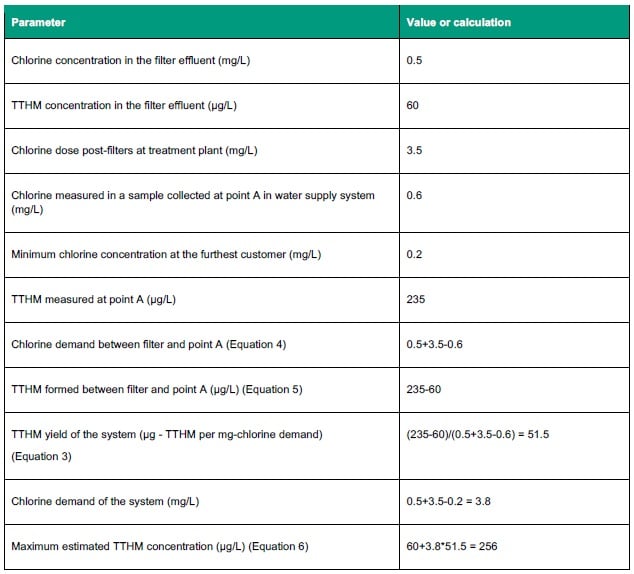
In the example in Table 3, the filter effluent has 0.5 mg/L chlorine residual and 60 µg/L TTHMs. A total of 3.5 mg/L chlorine is then dosed before leaving the treatment plant. At point A in the distribution system, chlorine residual is 0.6 mg/L and TTHMs is 235 µg/L. After point A, water still has the potential to form additional TTHMs until water reaches the furthest customer, where chlorine concentration is 0.2 mg/L.
To perform this calculation, the following formulae are used:
Regular monitoring of chlorine demand in the system and multiplying it by the calculated system yield (51.5 µg/L) should give a more accurate picture of maximum TTHM for this specific system than the simplest method does.
Assumption and validity of the methods
Both methods are not affected by the hydraulic variability as noted above. In Method 1, the major assumption is that bromide is <200 µg-Br/L. Method 2 assumes the water parcel sampled within the water supply system is the same as that sampled at the water filtration plant. Even if the water parcels are different, the method should still be reasonably accurate, so long as the following conditions did not occur in the last few days:
- Switching of water source;
- Major operational change in water treatment plant, especially chlorine dose; or
- Flood or heavy rainfall.
Need for cross validation
We suggest quarterly TTHM and chlorine demand measurements at two points for the first year following the suggested approaches. If the yield stays stable or the pattern of TTHM yield change is understood, then only chlorine demand needs to be monitored. In the subsequent years, we suggest annual measurement of the yield to check the validity.
Need for further research and nation-wide data collection
The simplest method (Method 1) based on average constant TTHM yield is approximate and does not include any system-specific issues such as corrosion or biofilms (Fisher et al., 2017a). It uses an approximate yield based on the data from 13 water samples from Australia and the US. Based on our experience in three waters from Australia, the TTHM yield did not change significantly over time/seasons. This is the best available method to estimate TTHMs without any detailed information about water quality, but only on the basis of dosed chlorine.
In reality, it is possible the TTHM yield of water may vary depending on various water quality parameters or over the seasons in a specific water source. Better accuracy would be achieved by using Method 2 over several years. Further research is needed to establish the sources of the variability of yield, so that water utilities can confidently use this method to accurately monitor TTHM levels and, where possible, eventually reduce the long-term health risks associated with TTHMs.
While collecting the data, we suggest that not only TTHMs but also chlorine concentration in the sample be recorded to understand the true potential (maximum TTHMs as shown in Table 1) of that water system, since any chlorine residual in the sample will still form TTHMs as water travels along the system.
As previously mentioned, the current ADWG guideline limit for TTHMs is much higher than those of the EU and US. The need to apply to and refine the methods proposed becomes much greater if Australia decides it should adopt the world's best practice in this area.
Similarly, if limits on individual THMs are adopted, the relationship of chlorine demand to TTHM formation proposed in this paper can be extended to similar relationships between chlorine and individual THM species formation, as demonstrated by Sathasivan et al. (2020). Their paper also shows that the presence of inorganic reducing agents such as ammonia can also be accounted for, where necessary.
The same concept could be extended to predict THM profiles along the system, but for simplicity the paper deals with only prediction of maximum TTHM levels.
Future work is also needed to estimate the cost savings of this approach for each water utility.
Conclusion
When it comes to public health safety, water supplied to consumers should meet both the microbiological and DBP requirements. All water utilities in Australia are ensuring microbiological safety of water, but there is considerable variation in monitoring and reporting THM levels across Australia, for the obvious reasons of cost and lack of resources and skills. This may not realistically reflect the long-term health risks from DBPs.
To overcome these limitations, two simple methods have been proposed to estimate the maximum TTHM levels in the system. The methods are based on generally available chlorine data and minimal TTHM measurements. It is envisaged that such methods will generate awareness among utility operators and regulatory agencies and could reduce monitoring cost for many utilities.
About the author
(Sathaa) Arumugam Sathasivan | Sathaa is a Professor in the School of Engineering, Western Sydney University. He obtained his PhD in Environmental Engineering from The University of Tokyo. His experience includes six years in Sydney Water Corporation where he worked on research and development projects including that within Corporative Research Centre for Water Quality and Treatment (CRCWQT). He also heads Western Sydney University’s Water Quality Group (WSUWQG) which undertakes water quality and treatment projects from utilities across Australia.
George Kastl | George is a chemical engineer with over thirty years’ experience, mainly in the water industry with Sydney Water, Worley Parsons and MWH. He is currently a Research Fellow in the School of Computing, Engineering and Mathematics at Western Sydney University. His recently completed PhD studies at the University of Western Sydney focusing on organic carbon removal during water treatment.
Ian Fisher | Ian graduated in Engineering from Melbourne University and obtained a PhD in Water Engineering from the University of NSW, Australia. As Principal Scientist/Consultant with Sydney Water Corporation for almost twenty years, he led major projects in measurement and modelling of water quality in lakes, reservoirs, rivers, estuaries and distribution systems. In addition, Dr Fisher was the Foundation Coordinator of the Distribution System Research Program in the national Cooperative Research Centre for Water Quality and Treatment.
References
AECOM, (2010) Review of regional water quality and security: Volume 1 - Review and Reform Strategy, https://www.infrastructureaustralia.gov.au/sites/default/files/2019-06/Review_of_RegionalWaterQuality_and_Security_Volume1_251010.pdf (accessed on 01 Oct 2010).
de Castro Medeiros L, de Alencar FLS, Navoni JA, de Araujo ALC, do Amaral VS. (2019) Toxicological aspects of trihalomethanes: a systematic review. Environ Sci Pollut Res Int., 26(6):5316-5332. doi:10.1007/s11356-018-3949-z.
Environmental Protection Agency (EPA) (2010) Comprehensive disinfectants and disinfection by-products rules (Stage 1 and Stage 2): Quick Reference Guide, United States.
Fisher, I., Kastl, G., Sathasivan, A., Chen, P., Van Leeuwen, J., Daly, R. and Holmes, M. (2004) Tuning the enhanced coagulation process to obtain best chlorine and THM profiles in the distribution system. Water Science and Technology: Water Supply, 4(4), 235-243.
Fisher, I., Kastl, G., Sathasivan, A., Cook, D., Seneverathne, L. (2015) General model of chlorine decay blends of surface waters, desalinated water, and ground waters, Journal of Environmental Engineering, 141 (12), 04015039.
Fisher, I., Kastl, G., Sathasivan, A. (2017a) New model of chlorine-wall reaction for simulating chlorine concentration in drinking water distribution systems, Water Research, 125, 427-437.
Fisher, I., Kastl, G., Sathasivan, A. (2017b) A comprehensive bulk chlorine decay model for simulating residuals in water distribution systems, Urban Water Journal, 14 (4), 361-368.
Fisher, I., Kastl, G., Sathasivan, A. (2019) Cost-effective chlorination strategies for drinking water, Water e-Journal, 4(1), 1-13.
Health Canada (2006) Guidelines for Canadian Drinking Water Quality: Guideline Technical Document– Trihalomethanes, Federal-Provincial-Territorial Committee on Drinking Water of the Federal-Provincial-Territorial Committee on Health and the Environment, Ottawa, Ontario, Canada.
Ikechukwu, I & Karanfil, T & Ray, S. & Hur, J. (2019). A comprehensive review of mathematical models developed for the estimation of organic disinfection by-products. Chemosphere. 246. 125797.
NHMRC, NRMMC (2011) Australian Drinking Water Guidelines (ver 3.5) Paper 6. National Water Quality Management Strategy. National Health and Medical Research Council, National Resource Management Ministerial Council, Commonwealth of Australia, Canberra, updated in August 2018.
Sathasivan, A., Kastl, G., Korotta-Gamage, S., Gunasekera, V. (2020) Trihalomethane species model for drinking water supply systems, Water Research, 184, 116189, https://doi.org/10.1016/j.watres.2020.116189
World Health Organization (WHO) (2017) Guidelines for drinking-water quality: fourth edition incorporating first addendum, Geneva.

