BOM reports find increased water usage
The Bureau of Meteorology’s annual reports into water pricing and use in Australia have found that groundwater use and urban water use have both increased, while utilities continue to expand capital expenditure on water supply and sewerage services.
The Bureau of Meteorology (BOM) has released the National Performance Report for Urban Water Utilities (Urban NPR) and the National Water Account for Urban Regions (NWA–Urban Regions) for the 2019–2020 financial year.
BOM’s reports highlight a number of key trends across a range of areas. The Urban NPR, which covers 85 utilities serving more than 23 million Australians, looked at 166 indicators encompassing water resources, pricing, finance, customers, assets, health and the environment. The NWA–Urban Regions report includes 11 nationally significant water management regions, including six urban regions, and covers 70-80% of Australia's water use.
Jeff Perkins, General Manager, Environmental Prediction Services at BOM said that the reports provide a comprehensive and complimentary assessment of water availability, management and utility performance in Australia's major urban centres.
"The Urban NPR and the NWA–Urban Regions have been going for fifteen and eleven years respectively, which provides a long-term record allowing customers, governments and utilities to benchmark or compare water management and service provision to urban communities across Australia,” he said.
“Independent public reporting encourages transparent, efficient and cost-effective water management and service delivery.”
Key findings
Despite some rainfall relief for eastern Australia in the early part of 2020, national urban water use, including regional urban centres, increased by 2%, following a second consecutive year of below-average rainfall.
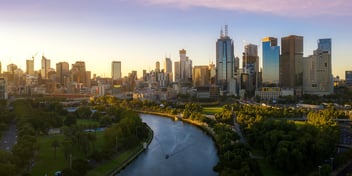
In response to dry conditions in the latter half of 2019, urban utilities opted to reduce pressure on their surface water resources and increase reliance on desalinated water supply and groundwater to meet urban demand. In Sydney, desalinated water made up 13% of urban supply, the highest contribution since 2010–11, while in Melbourne, desalinated water made its highest ever contribution at 24% of urban supply.
Water sourced from groundwater increased by 12% nationally compared to the previous year, with groundwater an important source for Perth and areas outside the major urban centres.
For a fifth consecutive year, and even with increased use of desalination, residential bills have remained steady with a national annual decrease of 2% (or a $32 decrease in the national median typical annual residential bill).
Investment in urban infrastructure continues to grow with total capital expenditure on water supply and sewerage services by utilities increased for the fifth consecutive year, an increase of $225 million or 5% from 2018–19 to 2019–20.
Water storage levels varied significantly across the country. For Sydney, significant rainfall in February 2020 saw total storage volumes almost double to 80% full in 10 days — the first significant rise since June 2016. In South-East Queensland, storage levels at 30 June 2020 were at their lowest level in more than 10 years (60% full).
Below-average annual rainfall occurred across much of southern Australia, including most of the urban regions. Annual rainfall in South-East Queensland was below average for the fifth consecutive year. In contrast, Melbourne was one of the few regions in Australia that experience above-average rainfall.
Perkins said that BOM is continuing to look at ways to improve the scope and findings of the report.
“To inform future Urban NPR production, the Urban NPR indicators are currently being reviewed, a process that includes extensive consultation with water utilities,” he said.


