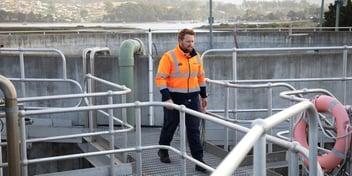
Here’s how data visualisation aided operations for TasWater
Tasmania’s water utility has improved efficiency, productivity and a company-wide understanding of asset performance priorities through the use of data visualisation, the simulation of often disparate data sources, to create data visuals outlining performance indicators and optimised maintenance responses.
Presenting at the upcoming Ozwater’18 on TasWater’s business insights data visualisation work, the company’s Asset Performance Senior Treatment Engineer Mark Rippon said data, which is more readily available than ever before, is the new currency of the water industry.
“We have lots of data and that data has a monetary value to us in terms of optimising the operation of the business to deliver customer outcomes. We need to treat it like currency so that we can manage and use it wisely,” Rippon said.
Rippon said by employing data visualisation, TasWater has a better understanding of how to invest, respond to risk and communicate performance, all of which has a fiscal impact upon the business.
“Our asset performance teams are looking at our current asset classes and how they are performing so that we can drive productivity, reduce risk and communicate the performance of those assets throughout the business better,” he said.
“By optimising our preventive maintenance, working together with our operators and maintainers and demonstrating our risk exposure within the business, we are better equipped to improve asset reliability and therefore improve our levels of service. We also have a clearer picture of where we can reduce costs in certain areas of the business.”
Furthermore, Rippon said this approach also helps to ensure that all areas of the utility business understand the key performance indicators and how best to move forward in light of business objectives, keeping everyone focused on achieving a shared vision.
“Typically utilities present data in various ways, which can sometimes cause confusion when data is interpreted in different ways. What we are trying to do is standardise that visualisation so that everyone sees the same thing and is talking the same language,” he said.
“It’s really important to make sure people are familiar with the visualisation and that it supports the metrics that the business is trying to improve.”
Rippon also said the benefits of approaching data in this way are not only financial, but also place the utility in a good position for becoming more transparent with customers, regulators and investors about performance in future.
“There is a fiscal side which is quite important to the business because we have to drive down our operating costs,” he said.
“But there is also the performance side of it – meeting our customers’ expectations in terms of ensuring our treatment plants produce safe drinking water or ensuring that our sewage pumping stations are not adversely impacting the environment.”
The use of this form of data visualisation has the opportunity to expand, and Rippon said “good quality data” presents many ways for the approach to prove useful in future.
“We can bring other data in to better understand certain impacts. For example, we could source data from the Bureau of Meteorology to better understand a sewerage networks’ response to rainfall,” he said.
“We will continue to improve the way we collect and analyse data. Hopefully, we will get to the point where the information is transparent to our regulators and customers and potentially, we could share that performance data readily, perhaps on a real time basis.”
Register for Ozwater’18 to hear more from Mark Rippon on TasWater’s data visualisation.
More from Mark Rippon:
https://omny.fm/shows/australianwater/mark-rippon-on-data-visualisation

